SenseMaking Experiment
with SLIP Analytic Conjectures
November 6, 2001
Obtaining Informational Transparency with Selective Attention
Dr. Paul S. Prueitt
President, OntologyStream Inc
October 24-25, 2001
The Analytic Conjecture is the key to Shallow Link analysis, followed by Iterated scatter-gather and Parcelation (SLIP) technology.
As an exercise in the use of SLIP, the following experimental write up will take the steps from the Analytic Conjecture through to the automated construction of a SLIP Framework. We will make some preliminary comments on core elements of the SLIP Technology.
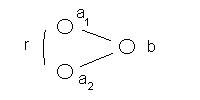
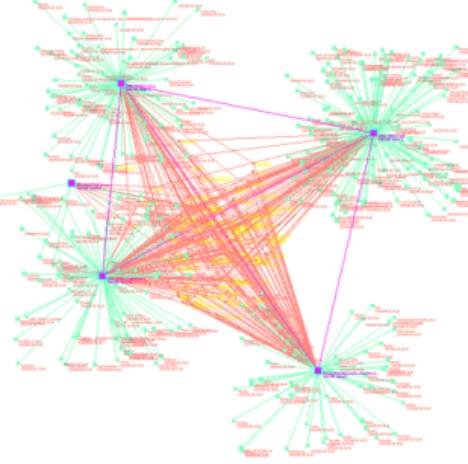
Figure 1: The non-specific relationship graph
Analytic Conjecture:
Goals: One
might be able to develop a sense of shared tools within a large of small
community by looking at data elements that might be hard coded into hacker
tools. For example, we can consider the
defender port used by a hacker tool.
The non-specific conjecture: We conjecture that there is a non-specific relationship between IP addresses that use common ports over the course of a reporting period.
Data Mart: We choose to develop a SLIP Framework from 7/15/01 RealSecure summary data, using the defender port as the “b” values (see Figure 1) and the attacker IPs as the “a” values.
Comments on this Analytic Conjecture :
1) On the surface one might be skeptical about the notion that attacker IPs would tell us anything. However, we are only bringing into the analysis attacker IPs that are linked by the common use of ports. We also must realize that the RealSecure database only logs events that have been determined to have hacker significance. The data is greatly reduced from the total number of possible transactions. The Analytic Conjecture organizes the data in a specific fashion. It is like SQL retrieval. Looking at the results of this conjecture takes very little time and the view of this data may result in some instant understanding that was not present before the inspect of the SLIP Framework.
2) The SLIP framework will show data organization. Skepticism is natural. But the value of seeing this organization can be demonstrated by domain experts, and in the increasing number of theorems and formal relationship that are being developed by logicians who have looked at the SLIP approach.
Figure 2: Defining a community { a(1), a(2), a(3), a(4), a(5) }
In Figure 2 we note that the analytic conjecture will establish a relationship between IP addresses that are using various ports; (b(1), b(2), (b3), (b4), but have on, at least one case, attacked through the same port. This is a wide net. Given the chaining relationship in Figure 2 we would expect that a(1), a(2), a(3), a(4), a(5) would become part of a single cluster.
Section 1: The three SLIP sensemaking cycles
We again use the PowerPoint presentation at URL:
http://www.ontologystream.com/EI/slipstream_files/frame.htm
The first of the slides in this PowerPoint is shown in Figure 1:
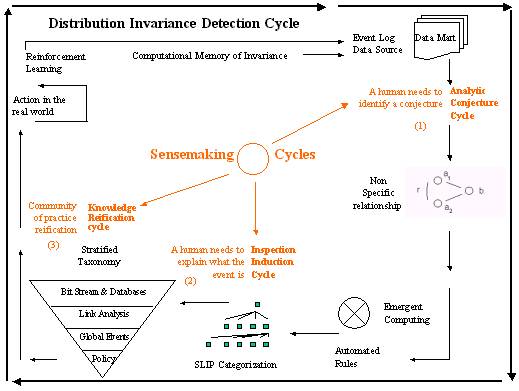
Figure 1: The full SLIP deployment architecture
A Distributed Invariance Detection
Cycle is an automated process that uses compression and categorization,
rule bases, and Petri nets to produce a computational immune system. As seen from the point of view of the four
layer stratified taxonomy, the Distributed Invariance Detection Cycle
algorithmically derive bit stream and intrusion summary data acquisition.
Distributed Invariance Detection Cycle contains plug and play components that allow
the evolution of Artificial Intelligence and data mining toolsets with a
familiar environment. Figure 1 is
suggestive of a distribution production environment that is made simple if one
uses only CPTS tools that have small technology footprints (this means no
traditional databases and no complicated web servers.)
A measurement of the processes that are
occurring in the Internet is made so that event logs of various kinds are made
available to the Analytic Conjecture Cycle. As we will see in an example, described in
the next sections, the Analytic Conjecture produces three
resources.
1)
a set of goals
that are or might be brought into focus
2)
the
non-specific conjecture in the form of a graph
3)
a data mart
consisting of two columns of data derived from an event log
We will address each of these three resources
in the example.
Outside of the purely computational processes
involved in the Distributed Invariance Detection Cycle, there are
three distinct action perception cycles that must involve human sense making
and judge.
The 1st cycle involves a human judgment
regarding the development of an analytic conjecture. Tacit knowledge of an expert is required as well as someone who
has a sense of why the SLIP emergent computing might produce new information automatically. The event log has one type of information.
what SLIP does is to create an event category by the prefect
recall of all event pairs that are "joined" by the analytic
conjecture. Example: if two attackers
attack the same defender than there is a non-specific relationship. If a chain relationship is identified within
a collection of several thousand of these joined pairs, then an event
category is identified. The event
category is not a statistical artifact, but rather a categorical
artifact that uses graph theory related to the emergent aspects of the
linkages.
The 2ed cycle involves a different type of
expertise, and this has to do with the kinds and classes of events that have
been identified by the community, and the individual ability to bring language
as descriptive of the event categories (both existing and those being seen for
the first time).
The 3rd cycle is like the knowledge portal
concept (developed within the KM community) where a community is assisted in
evolving a technical language to talk about the history of event types and what
to do about events of one type or the other.
Each of these have a perception phase and an action phase.
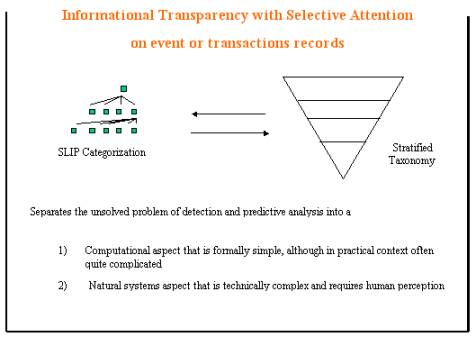
Figure 2: The separation of artificial worlds and natural worlds
In Figure 2, one of the foundational concepts is presented. This foundational concept is that the computer is a specific type of machine and follows rules that are to some degree “not natural”. The events that occur within the computer networks reflect the special characteristics of an artificial world where patterns can be identified exactly. Patterns in the natural world reflect near exactness and fractal like patterns, but not exactness.
Various scholars regard the difference as an important categorical difference. But scholarship is not necessary to point out that formal computer languages, such as query languages, are quite different from natural human language.
The four layer stratified taxonomy proposed in our IRAD work separates the patterns found in computers into two layers; bit stream and intrusion logs. Human language is used to specific common language in the other two layers (see Figure 3).
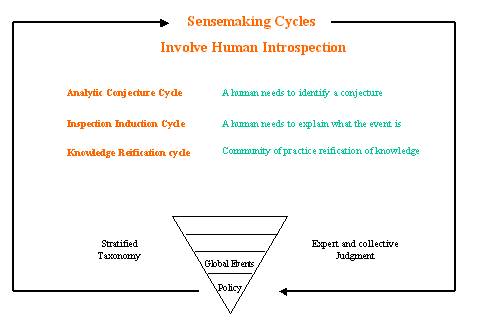
Figure 3: The three sense making cycles
Human involvement in analysis is as essential as the
computational process that produce the Distributed Invariance Detection Cycle .
Expert and collective judgment is required to produce an active
discussion of real time events and historical context that is made possible due
to the Distributed Invariance Detection Cycle.
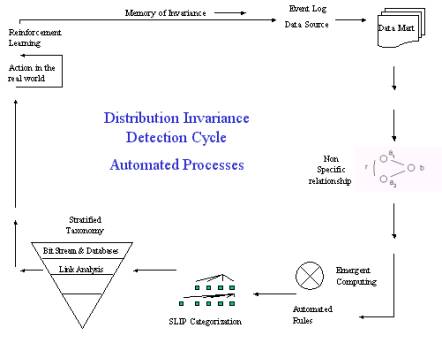
Figure 4: The automated processes within the full SLIP deployment architecture
In Figure 4 we show the full SLIP deployment architecture without the three human sensemaking cycles. The Distributed Invariance Detection Cycle establishes event log data archive to acquire two column data marts. These marts correspond with graph theoretic figures denoting non-specific relationships.
Emergent computing and automated rules will produce a SLIP Framework Tree (categorization) without human interventions. It is even possible, and desirable to automate the setting of parameters in bit stream and intrusion detection system (IDS) summary log files.
Section 2: Community
based use of the SLIP Framework
The analytic conjecture assumes that one might be able to see the events engaged in by a community. The community may be small of large, and much of the activity may actually come form members of a community only in the sense that their computer is being used without the owner’s knowledge.
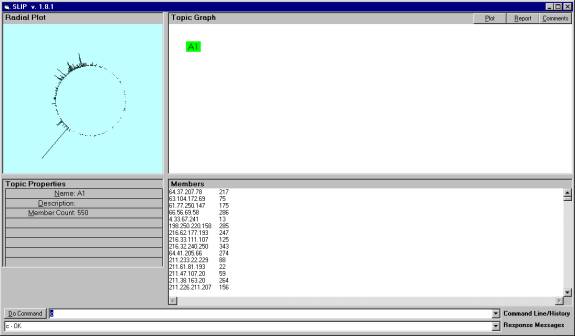
Figure 5: The initial cluster of 550 atoms for the Analytic Conjecture
A SLIP-enabled system is
attempting to measure and quantify human community intent based upon observed
actions. The human activity and
behavior is expressed in the computer networks and yet has an origin outside of
the computer network. This is precisely
the situation in quantum mechanics and in quantum-neurodynamics, where the
target of investigation is outside of the capabilities of any tool that allow
for a direct measurement of the target.
One has only the ability to infer cause and effect when sometimes cause
can not be seen directly and sometimes effect can not be see directly either. Thus the development of a proper
social theory to view SLIP deployment and use must rely on scholars
whose current expertise qualifies them.
The Analytic Conjecture is a
measurement about human activity and behavior made using event logs. This measurement has obvious application in
the location of potential terrorists or criminals. But the SLIP technology also is sure to have application in
bioinformatics and in other sciences such as astrophysics and quantum
mechanics. In these sciences,
practitioners are trained to understand the difference between a reliable
inference (which is often taken to be unquestioned in its truth) and a
plausible inference where various degrees and even types of uncertainly and
incompleteness exist.
There is a clear need to place the SLIP into
a deployment model where both reliable reasoning and plausible reasoning is
understood and anticipated. Some
distance training can be packaged with the deployment plan. The primary reason why the technology has
been simplified to very few software dependencies is so that the tool can be
easily used without encumbrances that often come with computer-based
tools. The simplicity of the tools to
use allows us to focus on a just in time distance learning processes that
helps domain experts to acquire a high level of skill in making the analytic
conjectures and in sharing knowledge within a community of practice.
This type of deployment requires some effort
to understand the social aspects of knowledge sharing when knowledge is
incomplete and conjectural. For
example, it is conjectural to consider that a SLIP cluster will map to a
repeated behavior of a hacker group or community when the community is loosely
held together. Many cyber warfare
specialists are trained to ignore emergent behavior that has no obvious source
of leadership. But emergent computing
shows that emergence is a real phenomenon and thus allows these specialists to
overcome a simple cause effect paradigm so that phenomenon like new hacker tool
propagation in the Internet can be understand as an emergent phenomenon with a
SLIP Technology Browser.
A new science is possible, IF there comes to
exist a conceptual framework that domain experts can use to develop common
knowledge about the invariances that are seen using variations on the SLIP
Analytic Conjecture, and conjectures regarding the real world events
such as correlating event logs (both financial and computer transactions) with
hacker community intentions.
In summary of the above points” the use of the SLIP to map human community behavior requires some expertise in change management and process engineering. The point of a deployment strategy must be to organize how domain experts approach the use of the SLIP technology. If the technology is not well studied and supported properly then an important new tool will be misunderstood and perhaps lost.
Let us try to anticipate some of the issues.
Using the demonstration software we produced a cluster with 18 IP addresses. Retrieval from the data mart and data warehouse (in this case the RealSecure summary log file) produced several hundred events. The events are a few Windows_Access_Error and hundreds of Port_Scan and hundreds of DoS_Stream.
SLIP theory suggests that the subset of around 500 of total 56,000 RealSecure log events is involved in a single “event” and that this event involves these 18 IP addresses The theory has to account for how the boundary of an “event” can be determined. But this type of work has to depend on the study of the use of the SLIP in real situations.
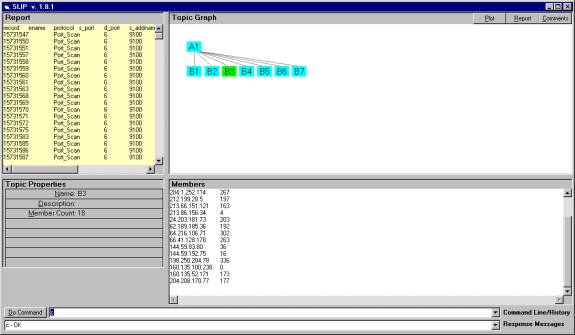
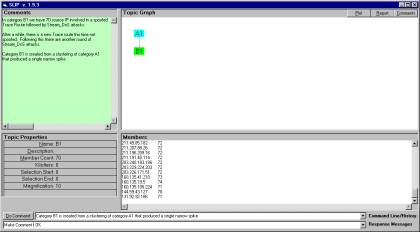
Figure 6: The B3 category with 18 IPs involved in several hundred Port_Scan, Windows_Access_Error and DoS_Stream events.
The beginning 1/3 of the events in Category B3 suggest that a process has been engaged whereby first there are port scans, then window access errors and then Dos. It is interesting to note, that the DoS does not focus only on one of several ports but selects a large number of different ports. This may suggest that there is something more than denial of service attacks in progress.
15731547 – 15732306 port scans
15776755 – 15776756 window access error
15777115 – 15779535 Stream DoS
It would be useful to have the seconds that the events occurred rather than simply the record number and the date. Once this type of data is available to OntologyStream, then we will be able to mechanically identify the temporal boundaries of a distribution attack event. This is quite a claim, and we await a proper data set to demonstrate this capability.
Section 3: An analysis of the categories
We start with a random scatter of 550 atoms to the circle. These 550 IPs are about 1/3 of all IPs that where involved as source IPs in the test set of 56,000 records. Stand-alone software is available that demonstrates the following procedures.

Figure 7: The scatter of 550 atoms to the circle.
Figure 7 shows a single node in the Topic Graph window and a random distribution of 550 atoms to the circle in the Radial Plot window. Topic Properties indicate the magnification and other metadata elements. These elements are (soon) to be stored in XML resources and persisted even when the Browser is closed.
The short horizontal line inside the circle is a movable indictor of position. It is controlled from the command line.
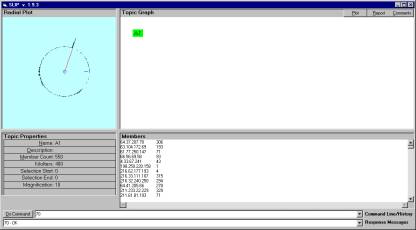
Figure 8: The use of position indicators
Manual selection of clusters allows the domain expert flexibility. In Figure 8 we see a line drawn from the center of the circle out to the edge at degree 70. This is done by typing “70” in the command line.
The user can identify and select circle intervals, [ degree a , degree b ], and define children to the A1 node. An “undo” function allows the user to undo the selection and examination steps, so that emerging phenomenon can be explored at well. If the category is not interesting then the user can return to a previous state.
The Topic Properties in Figure 8 indicate that 400,000 iterations have been applied to the distribution. This process takes about 43 seconds on a slow Compaq computer. The clustering process is interesting to watch and can be stopped at any time. The distribution state is updated once every n iterations where n is a parameter. Once stopped, new categories can be manually defined and inspected.
A category can also be manually deleted and the clustering process re-started with the persisted distribution state.
The speed of the process is due to an original algorithm developed by Prueitt and Mitchell for finding short strings (of length around 20 characters) in very long strings (of length around 20*18,000 = 260,000 characters). This innovative pattern-matching algorithm will run 400,000 such string searches in the 43 seconds. The pattern matching is similar to those used in bioinformatics and genome research (Developing Bioinformatics Computer Skills” published by O-Reilly, 2001)
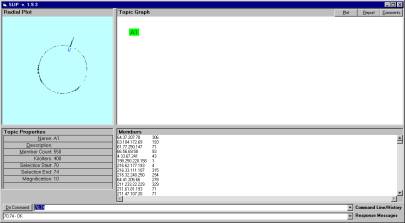
Figure 9: Using position indicators to visually indicate the boundary to a cluster
In Figure 9 we delineate the boundary of the spike between degrees 70 and 74. A small blue indicator appears inside the circle adjacent to the spike. A subset of the total number of atoms is being identified visually and then indicated using the command “70,74”. However, this spike could also be identified automatically using a convolution operator over windows of various sizes. The convolution is necessary to capture all varieties of clusters; from narrow spikes to broadly distributed clusters.
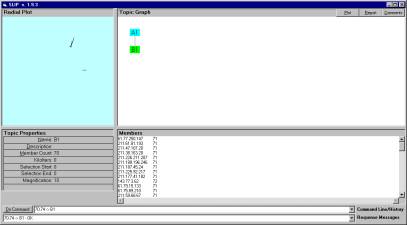
Figure 10: Creating new topics
The command 70,74 -> B1 creates the child node B1 and gives this node the membership of those atoms that are delimitated by the indicators of position.
Once the child node is developed it is possible to apply various processes just to the child node. One of these process is to produce a report of all events that where logged by RealSecure and related to the 70 source IPs present in category B1.
The complete report can be cut from the SLIP Browser and pasted into a text file. The same is true for the members window and for comments. In a few days, we will be able to directly save the bit map from the radial graph to a .bmp file. These features allow the domain expert to develop reports that have a standard format.
Knowledge sharing is also enabled by an archive of the comments made by analysts.
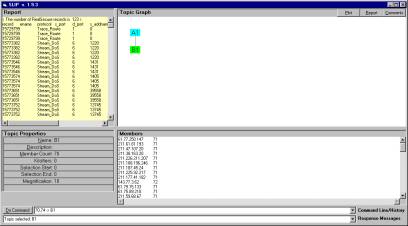
Figure 11: Access to the RealSecure reports
The Distribution Invariance Detection Cycle contains and defines processes that move information from one type of perception action cycle to another (see section 2 above). A persistent work product is acquired and accessible in the form of a four layer stratified taxonomy.
The bottom layer is a database warehouse and bit stream analytic objects (tensor structures acting on next generation in-memory databases). Link analysis creates the input of evolutionary programming techniques that result in discussion between humans. The community of practice then reifies a knowledge taxonomy that facilate shared knowledge and coordinated action.
These are new concepts that need to bother the domain expert since the SLIP Technology Browser encapsulates these advanced algorithmic techniques.