Service
Link analysis, Iterated scatter-gather and Parcelation (SLIP)
The Event Browser:
Exercise I
December 14, 2001
Obtaining Informational Transparency with Selective Attention
Dr. Paul S. Prueitt
President, OntologyStream Inc
December 14, 2001
The Event Browser:
Exercise I
Friday, December 14, 2001
This exercise
has two parts. In Part 1 we take the
user through all of the steps required to use the three SLIP Browsers. In Part 2 we engage in a discussion about
what our development needs are in order to complete the foundational software
for Event Chemistry.
Part 1: The Three Browsers.
The zip file
needed for this exercise is available at:
http://www.ontologystream.com/SLIP/temporary/ebI.zip
In the zip
file one will find three browsers and a data file. This data file will contain the datawh.txt file that we developed
in a previous exercise. The datawh.txt
is a filtered event log from a 120,246 record
transaction audit log and is discussed in Part 4 of the Arbitrary Event Log
Exercise. Our datawh.txt has 12,024
records and is 642K.. The user should
open this file, with any work processor, and examine the contents.
To start this
Exercise, please delete everything from the Data Folder except datawh.txt. One can regenerate this data folder from the
zip file later to check your work.
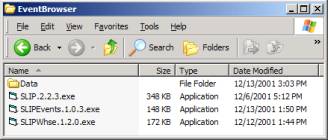
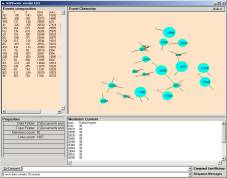
Figure 1: Contents of ebI.zip
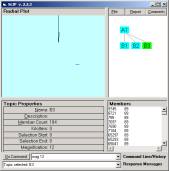
After
examining the datawh.txt file, double click on the icon for SLIPWhse.1.2.0.exe.
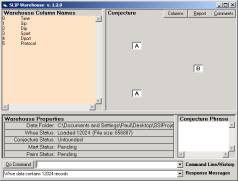
a b
Figure 2: The development of Analytic Conjectures
Technically
any of the pairs of the columns will work as an Analytic Conjecture. Some of these will not be interesting and
some will have long computational times.
For example,
setting the atoms to Dport and the relation to Sport will take a few minutes on
a fast computer to generate the A1 node seen in Figure 3a. This view is interesting in that this is how
a external source port will see the normal operating mode of a Linux web
server. The data that will show Figure
3a is available from the zip file dportssi.zip
(1,555 K)
http://www.ontologystream.com/SLIP/temporary/dportssi.zip
Rather than
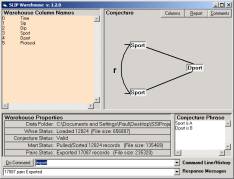
look more deeply into the Analytic Conjecture (sPort, dPort), we will develop
our exercise around the Conjecture (dPort, sPort).
Figure 2b is
developed by using the commands:
A
= 3
B
= 4
Pull
Export
These commands
will create the files Conjecture.txt, Links.txt, Mart.txt, and Paired.txt and
places these files in the Data folder.
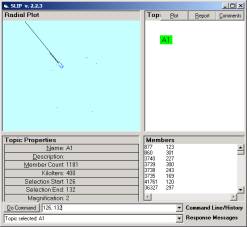
a b
Figure 3: Two different A1 nodes, a
is from (sPort, dPort) and b is from (dPort, sPort)
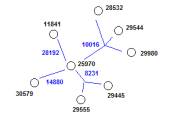
Of course in
Figure 3b we have not yet clustered the atoms.
In a previous
study of the entire (unfiltered) SSI dataset, it was noticed that a large spike
formed and then a small group formed away from the large spike. The small group then moved slowly towards
the large spike. As the smaller group
moved towards the spike, there is a periodic exchange of atoms between the two
“events”.
We hoped to
find this same behavior in the filtered set, and we did (see Figure 4)
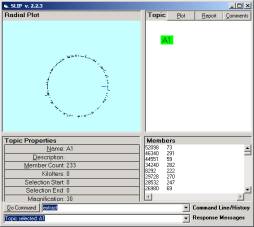
a b
c
Figure 4: Event decomposition of A1 into three
events
The data that will
show Figure 4 is available from the zip file sportssi.zip
(127 K)
http://www.ontologystream.com/SLIP/temporary/sportssi.zip
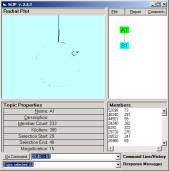
The ending nodes
of the SLIP Framework are then tested to see if the ending nodes are in fact
prime. B2 is not and so a
re-scatter-gather is done to remove 3 of the 10 atoms and place these 10 atoms
in category C3. At this point we have
three prime categories. B1 has 18
atoms. C1 has 10 atoms and B3 has 184
atoms. Recall that category A1 has 233
atoms.
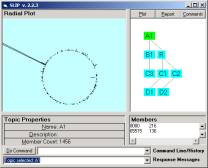
Now the user
should develop a similar SLIP Framework.
The user should launch SLIP.2.2.3.exe and type help to review the
available commands. Then the user
should type:
Import
Extract
Followed by
clicking on the A1 node to see the 233 atoms randomly scattered to the circle.
Cluster
300
Cluster 300
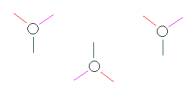
will produce something like Figure 4a.
If it is not clear that a smaller cluster is approaching a large spike,
then type:
Random
Cluster
300
A few times
until you recognize the phenomenon.
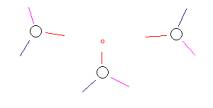
Note that the
phenomenon we are looking at is a transient phenomenon since the small cluster
will eventually move and join the spike.
The user can see this by clustering 2,000,000 iterations.
Cluster
2000
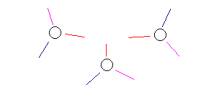
Now
re-randomize and cluster 300 (300,000 iterations). Use the bracket command to pull subsets of the atoms into three
categories. The first is the small
cluster that is moving towards the large spike. The second is all of the atoms in between the small cluster and
the large spike. The third is the large
spike itself.
Click on each
of the ending nodes and check to see if the node is prime.
Random
Cluster
100
If all of the
atoms go to the same location, then the node is prime. If the node is not prime then take the part
that moves together and bracket it into a new category.
Now we can
generate Reports and look at the event chemistry.
The current
version of the SLIP Technology Browser does not know the correct column to use
in the Report and so we have to use the key command. In our case the atoms are from column 3 of
the warehouse.
Key
3
Generate
These commands
are used to key the Report mechanism and the generate the Report for the selected
node.
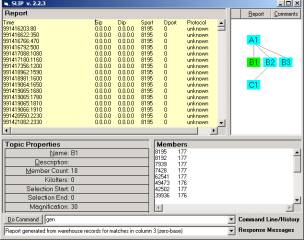
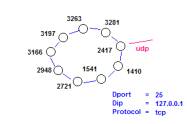
Figure 5: Generating the Report for B1
One should
check to see that each atom in the members list produces at least one record
from the original event log. If this is
not so, then the key is not set correctly.
The user
should generate reports for each of the prime nodes.
Two things
should be noted. First, all Dip values
in the event log are 0.0.0.0 so this is not useful information. Second is that the column names have to be adjusted
by hand and this is done clicking into the Report window and using a control
tab key sequence (a tab will just move the control around the screen)
As expected,
the Report for B3 is almost the entire original datawh.txt.
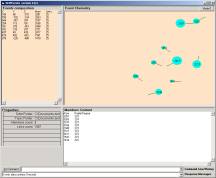
First use of the Event Browser
Everything is
now set up to use the Event Browser.
Well, almost everything. Our
design calls for a SLIP technology Browser command line to open an Event
Browser and take only the atoms related to the selected node into the Event
Browser.
As of now, we
need to do some of this by hand.
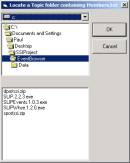
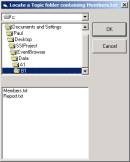
Figure 6: The selection of the Member.txt for the
Event Browser
We now use a
standard Locate File Browser to select the node that we wish to examine with
the Event Browser. We need to find a
Members.txt. On selection of a
Members.txt, the Event Browser randomly scatters the atoms into the viewable
manifold (left display window).
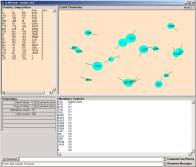
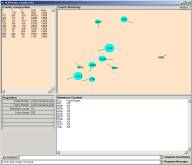
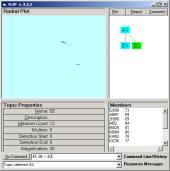
a b
Figure 7: The scattered atoms of category B1 and
C1.
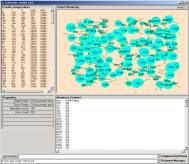
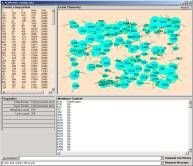
c d
Figure 8: Two different initial distributions of
the scattered atoms of B3
Each time one
wishes to see a different node, one has to open a new Event Browser. Each time one opens an Event Browser to see the
atoms of a category, the random distribution will be different.
The user can
experiment with the Browsers. Please call Dr. Prueitt if you have any
questions.
Part 2: On completing the Event
Chemistry
In http://www.ontologystream.com/SLIP/files/ArbitaryEventLog.htm
we have drawn two event graphs from a test set given to OSI Inc by Software
Systems International (SSI). The SSI data
set is a log dump from the normal operation of a LINUX web server.
a
b
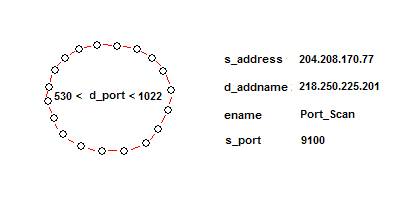
Figure 9: Two hand draw event maps
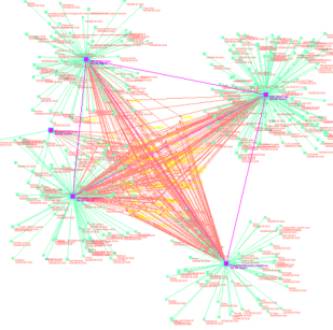
In
Figure 9, the two hand drawn events are from the D1 and D2 nodes of the data
set ssidata.zip. This
2.14 Meg zipped file is available from:
http://www.ontologystream.com/SLIP/temporary/ssidata.zip
When
used with the SLIP Technology Browser we will see Figure 10a.
a
b
c
Figure 10: The display of atoms in
categories D1 and D2
Figure
10b and Figure 10c show the first version of the Event Browser that scatters atoms
with linkage into the display window.
The design problem that we now face is now to automatically generate
things that look like Figure 9 and Figure 10 using a push-pull process like the
scatter-gather to the circle.
On
the nature of emergent computing
There are several schools of thought regarding what emergent computing is and what are its consequences. We take as our model here the scatter-gather technique used in clustering concepts in text collections. We do not take as our model genetic algorithms. This can be done, but we have not applied either genetic algorithms, or evolutionary programming and normally considered in the literature.
The scatter is a one time random distribution of units (atoms) into a manifold. The gather is a stochastic process that can produce meaningful clusters in the limiting distribution.
The
problem with gathering is that movement towards organization must be balanced
with a complementary reintroduction of diffusion. The basic concepts come from both cosmology and
thermodynamics. The effects are simple
to observe. The emergent structures
that develop should:
1)
Evenly
distribute themselves into the manifold (the notion of a manifold is a general
notion for the region where the scatter-gather has occurred)
2)
The
structures themselves should have a tension that spreads the graph so that
figures like Figure 9, Figure 11 and Figure 12 occur automatically.
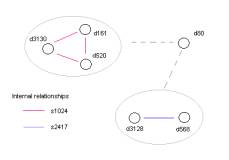
Lets us look again at Figure 9b. This is like the Port-scan figures we have seen in previous exercises, for example Figure 11b.
a
b
c
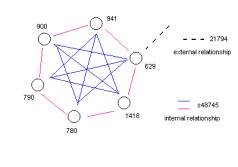
Figure 11: Some early event maps
In
Figure 11b we have two colors of links, the red and the blue. The blue links could also be rendered as in
Figure 12.
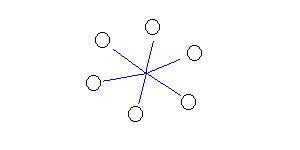
Figure 12: Alternative event map for Figure 11b
Our current problem (one that at this writing has not been solved) is how to use principles from thermodynamics to diffuse the location of individual atoms while at the same time bringing all of the common links together.
Figure
11c is clearly not consistent with what can be directly computed from the
scattered atoms with different types of links.
The red linkage of both Figure 11a and 11b are derived from a transitive
relationship. It is therefore a derived
rendering schema, not one that we expect to see from emergent computing
directly.
This
issue is one of the last remaining issues for the prototype SLIP Browsers.
Issues
The
following issues are not something that the user will have to be involved in,
but the computer interface has to be programmed in order to produce acceptable
results.
Three dimensions
Currently,
we choose to have a three dimensional manifold where each atom has an x, y and z
position. The z position is used to
draw the size of the atom, resulting in the rendering of distance from the
viewer. However, since the three
dimensions are computed we may render this three-dimensional model in other
ways in the future.
The gathering movement of atoms
Two
type of locations are accounted for.
The atom’s center of gravity and the location of the link attraction
spot. Each atom has a center of
gravity. One end of a link is attached
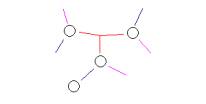
to the atom and one end has an attraction spot (see Figure 13). Each link type is colored coded so that
links of the same type have the same color.
For example, all port 80 links will have the same color.
Using
iteration similar to the gather of points on the circle, we select a link type
and move the atoms connected to these links.
If an atom is attached to other atoms, then the entire complex must be
moved along with the atom. The movement
also involves changing the position of the links that each atom has so that the
links of the selected color all point towards each other.
The
movement of atoms introduces a number of programs that we have to solve. What we are after is a reasonable rendering
of the compounds that form due to the link analysis as specified in the SLIP
Analytic Conjecture. The clustering of
the atoms on the circle is to identify interesting groups of atoms and to then
look at these in isolation from everything else.
Clustering
of the atoms on the circle provides a selective attention to just
those atoms that have a tight link relationship. Informational transparency is delivered in three
senses:
1)
The
data aggregation of invariance in the data is performed using very fast RIB
algorithms
2)
The
SLIP Analytic Conjecture provides a specific look at the data invariance
3)
Automated
processes are created from event graphs to actively look for the same
invariance found to be of interest by an analyst.
Informational
transparency with selective attention is delivered due to a perception action
cycle that uses an advanced view of data mining and the visual acuity of expert
humans.
One
key to instancing this perception-action cycle is the production of the event
graphs. So this work is essential to
the overall success of the Incident Management and Intrusion Detection System
(IMIDS) and to other vertical market development for SLIP-RIB Technologies.
1) 
a b
c d
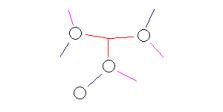
Figure 13: event chemistry dynamics
In the
gather aspect of the event chemistry we must overcome a number of
challenges. These are due to the nature
of an emergent computing task.
Essentially many local informational constraints exist and there are
conflicts similar to what we see between individuals when the individuals have
different points of view. So
adjustments need to be made.
In
Figure 13 we have been successful in moving all of the red links together. This is not done all at once because the
movement of single atoms, or complexes of atoms, will alter the other
relationships. So we move things only a
little bit and then choose a different color (link type) and make a small
adjustment there. This is a classical
technique first developed by Paul Werbos’ 1977 PhD thesis on the back propagation
of error in artificial neural networks.
Over
time the construction will sometimes settle down into a stable pattern.
The
phenomenon of stable patterns is similar to the phenomenon of the limiting
distributions in the atom gather on the circle. In some cases, the iteration on the gather will not settle down
completely and we see periodic changes moving back and forth between two
clusters or within a cluster.
Link positioning
In
Figure 13d we see that the purple links need to point in exactly the same
direction as the red links. This will
force the two kinds of links to occupy the same space. The problem has two aspects. How does one represent the fiber that
connects the atoms? How does one
overcome the rule that requires that links be displayed evenly from the atom’s
surface?
a b
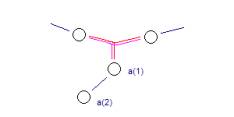
Figure 14: Creating connection fibers
having more than one link
Simply allowing the links to turn and point from the surface without reqard to how the other links are pointed solves the first problem. In the case that a connection occurs, then the links have to be redrawn as a fiber bundle, as in Figure 14b.
The black link between a(1) and a(2) retains the configuration angle because a prior link existed between a(1) and a(2).
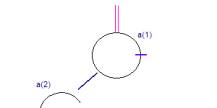
Figure 15: The configuration angles
A small event cycle has to occur during each gather of the event chemistry.
1)
A
color is selected
2)
All
attractor points of the links of this color point at the links’ center of gravity
(the average position). This may
involve kinking connections that are already made.
3)
Move
the atom complexes towards each other (just a little bit) so as to reduce the
difference between the position of the attractor points and the center of
gravity.
4)
Adjust
the position of all un-linked links on each atom affected.
The scattering movement of atoms
The scatter-gather process starts with a random distribution of atoms into a manifold where relative location of all the atoms can be co determined. As the gather process occurs there is a tendency to have everything move towards a common universal center of gravity. This tendency to collapse into a single mass must be over come with a diffusion process.
Cosmology identifies a similar problem in the organization of the universe by both diffusion and escapement processes. The notion of escapement (of an fast organization scale) leads one into the quasi axiomatic theory:
http://www.bcngroup.org/area3/pprueitt/kmbook/Chapter9.htm
and the voting procedures:
http://www.bcngroup.org/area3/pprueitt/kmbook/Appendix.htm
To
solve this problem we need a few constructions in the computer code. First all of the links and atoms have to be
active objects, with sufficient properties to remember locations, connections
and link positions. Active object also
allows us to hide properties such as name tags so that the display is not
cluttered with information.
The
current Event Browser (version 1.0.3) has all of the necessary plumbing.
Before
discussing the diffusion process, we should first consider why diffusion is not
necessary in the scatter-gather to the circle.
First, the scatter-gather to the circle is informationally simple. One can make this process more complex but
it is not yet necessary to detail how this would be useful. Second, the scatter-gather to the circle is
on a manifold that has no boundary with no preferred starting point. This means that a gather is also a diffusion
process.
This
property of having no preferred starting point tells us how we have to adjust
the event chemistry dynamics. We need
to have a diffusion field that is computed for each atom and then all of these
fields added together to provide a tension on the manifold. This tension is the diffusion field. As long as there is gathering movement, then
the diffusion field will push everything apart with equal power.
Development effort to provide the final event chemistry
The
end of the financial year often puts R&D efforts in a bind. This has been true for our effort also. Funding stopped for us on November 29th,
2001 and funding restart is not expected until new arrangements are made.
The
Event Browser is almost fully designed and about 40% coded. The interactions between the SLIP Technology
Browser and the Event Browser are about 80% completed. The SLIP technology Browser and the SLIP Warehouse
Browser are fully operational (as of December 3rd, 2001)
We
estimate that a solid two months of work is required to complete the seamless
integration of the suite of three browsers.
Due
to economic considerations, OSI is willing to make almost any arrangement in
order to complete the work. However,
the one rule is that OSI placing into the public domain all new Intellectual
property as soon as it is created.
In
the next exercise, we will look at the use of the SLIP Technology to create a semantic
index between documents. A test set has
been developed for this purpose:
http://www.ontologystream.com/IRRTest/Evaluation/sl/bead1.htm
What
we hope is that this application will be seen useful to investment
decision-making that involves careful examination of the relationship between
themes in corporation stockholder reports.
A second application of the SLIP Text Examination technology is to be
made with a test set of Intellectual Property disclosures.