Index .
A Prototype Cyber Defense Knowledge Base
Tutorial
Copyright (2002), OntologyStream Inc.
Introduction
This paper has an advanced tutorial
and a proposal for future work. We show
the concept of visualAbstraction (vA) in order to suggest how vA might be used
to protect the backbone of the Internet, the routers, gateways, and
switches. The so-called “last mile” is
where millions of LANS, database systems, and private home operating systems
are located. The last-mile is where most
of the value of the Internet has been to now.
But these “end-nodes” are largely private, not public,
responsibility.
Public responsibility is not the
same as private responsibility. It is
our intention to help delineate the public responsibly for securing the
Internet backbone and assisting in the evolution of a tamed Internet. This delineation will contribute to the
definition of private responsibilities that occur as individual and companies
put end nodes, and computational power, into the new Internet.
Some additional development work is
required on the visualization and navigation algorithms, as well as the knowledge management system. This additional work contributes to the
completion of:
- Commercial
Vader (Visual Abstraction Database for Emergancy Response)
We seek private foundation support
related to our work on the Nation CDKB.
OSI is giving away the SLIP
browsers to the researcher community in order to make the concept of vA well
known.
OSI’s work is basic research that appears
to have produced a horizontal technology with applicability to a large number
of verticals. Only one of these
verticals is the National CDKB and commercial Vader ™ market.
As of March 1st, 2001,
OSI has a partner for cyber security deployments. OSI and this partner are proposing an at-cost provision of
visualAbstraction technology as part of a contribution to Homeland
Defense. In addition to the National
CDKB , the partner will provide a commercial off the shelf product, code named Vader
™ . Vader ™ will
be the only source of OSI supported visualAbstraction technology for Cyber
Security.
Four other verticals are being
negotiated. These are BCNGroup
BeadGame Communities, TraceBehavior,
IPEvaluation, and B2B. TraceBehavior ™ is a study of financial
information database transactions.
IPEvaluation ™ is a study of functional load between patent and other IP
property descriptions. BCNGroup
BeadGame Communities ™ is a process model for transforming e-forum, e-mail and
chat systems into a knowledge management system based on full text analysis of
the linguistic functional load of word occurrences in sentences and
paragraphs.
The largest vertical is B2B and
B2C. OSI expects to announce a
venture-funded partnership between OSI and a third party. This partnership will focus our branding
efforts in B2B and provide a standardization of eventChemistry and
visualAbstraction web services.
Section 1: Discussion
We will look at a data set provided
from Above Security Inc to OSI from an Internet trunk. This is the first set of
data from this source. The original
file contained 50,816 records sanitized from AboveSecure Inc (www.abovesecurity.com)
data. This is 14 minutes of raw data
from an Internet truck.
What is proposed is a formal study
of this trunk’s data flow over a period of one month. The intent of this study is to develop a set of known atoms and
to organize these atoms into a semiotic table of some sort. The semiotic table provides
- A
control language for retrieval and routing of information in Vaders
- A
visual display of the event types occurring in the data flow
The period table used in physical
chemistry is a semiotic table. However,
we have the promise that the Vader control interfaces will have active visual
icons, visual abstractions, that provide a real time view of categories of
atoms and eventCompounds.
The development of categories and
the consequent definition of abstractions start with the measurement of
invariance. Instrumentation
produces log files, and these log files are acquired by placing a
tab-delineated form of the log files into the Data folder. One can update the datawh.txt file in the
Data folder and produce a trend analysis of the events.

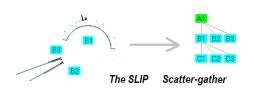
Figure 1: The analytic
conjecture allowing src_port to organize dst_port
After the datawh.txt file is in
place it is mapped into an I-RIB
system. The I-RIB is used to develop a
formal foundation of data transformation related to developing the functional
load of atoms in the context of a SLIP analytic
conjecture.
The specific conjecture used is one
of many that are possible. Each
conjecture will produce a collection of visual abstractions that reflect the
nature of very specific event types. For
example, we hold forward the claim that 5 major event types and perhaps 100
minor event types span the complete behavioral spectrum of an Internet
trunk. This is to be demonstrated in
the next
advanced tutorial.
Consistent with semiotics control
theory and situational logics, the visualAbstractions provide information about
event variations, anomalies, functional behavior and trend analysis.
One can compare this study with a
preliminary study of the Cylant Instrumented
Linux system. This study relies on
sensor code that has been added to the Linux OS code by Cylant.
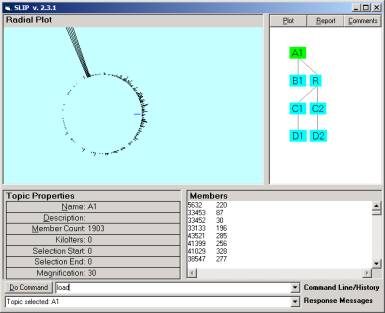
Figure 2: A formative
distribution of atoms and categorization based on clusters
50,816 records produces 1903 SLIP
atoms under the conjecture in Figure 1.
What this means is that 1903 abstractions (of atoms) are used to replace
the 50,816 records of data for purposes of visualization. There are 2647 simple compounds produced
from these 1903 atoms. However, 2611 of
these are two atom simple compounds. Only 36 non-simple compounds have more
than two atoms.
SLIP atoms provide one type of
abstraction. This abstraction can be
used for:
- Control
of sensor measurements and for automated response to incidents
- Retrieval
of original data used in developing the abstraction
- Filtering
and routing of data having similarity to the data used in developing the
abstraction
- Input
into the eventChemistry process.
The eventChemistry provides
startling visualization capability, which we have only just started to
demonstrate. In Figure 3 we show a few
of the visual abstractions. These
images need to be categorized with the assistance of our colleagues in a few of
the smaller private CERT type organizations.
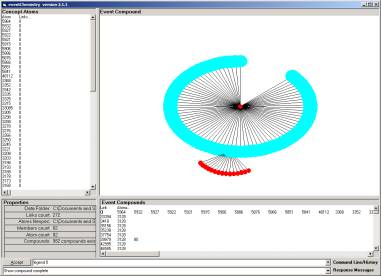
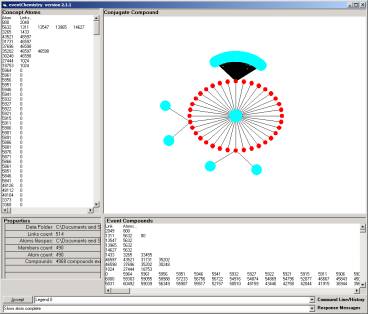
Figure 3: Some simple
non-primes
The SLIP atoms are linked together
pairwise and those atoms that are connected under this linkage form a new level
of abstractions called event compounds.
The CLIP atoms will have more than one conjecture and
the compounds with have a different quality that those in Figure 3.
Event compounds are simple or
complicated depending on the number of links required in identifying a prime
structure. A prime is a group of atoms
that are connected in a graph having no external link.
The compounds in Figure 3 are
non-primes contained in a larger more complicated prime structure that we have
not rendered visually yet. One can
navigate to all other parts of this complicated prime using mouse clicks.
Section 1: The tutorial
This tutorial takes a 1/10 th split
of the data set used in the Introduction.
Then we split the data once again to get a 1/100 split.
Before looking at the 1/100 split,
we wish to show that the visualAbstractions seen in Figure 3 can be found in
1/10 the data.
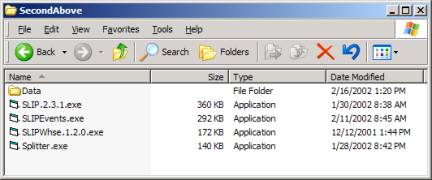
Figure 4: The four
browsers and the Data folder
Please download a zip file from the OSI web site and
unzip into a folder. When you have done this you will be able to find a folder
that looks like Figure 4. Inspect the
Data folder to find that there is one file of size 370K. Open it up and you will find 7 columns of
tab delineated ASCII values. Call OSI
if you have difficulty.
Open the SLIP Warehouse by double
clicking on SLIPWhse.1.2.0.exe. Issue
the commands
“a = 3” and “b = 1”
in the command line.
Figure 5 shows that 5081 records
are loaded. The Pull command
followed by the Export command produces 12,236 pairs of dst_port
values. Each pair corresponds to a
graph construct called a syntagmatic unit in the form of an order triple
< a1, b, a2 >,
where a1 and a2 are atoms and the b
value is a link relationship. These
ordered triples are the basic building block for formative ontologies.
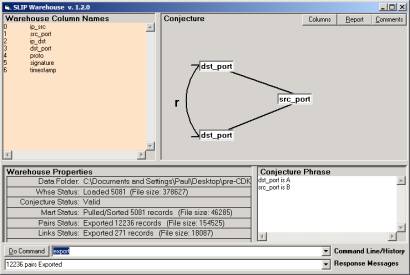
Figure 5: The conjecture
from Figure 1, but on 1/10th the data
Close the Warehouse. Inspect the Data folder to find that new
files have been created. You may
inspect these files if you wish. The
OSI browsers are, in fact, transforms on data files, taking ASCII files and
transforming the data into ASCII files.
Nothing is hidden about the input or the output to the OSI browsers
(using root-KOS), and thus there will be no standardization problems with SLIP
technology.
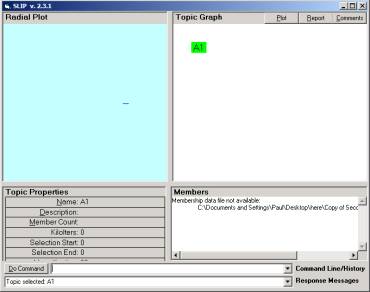
Figure 6: The opening
state of the SLIP Technology Browser
The OSI browsers are simple tools
that require some perception about the formal grounding of visualAbstractions
and eventChemistry. One uses these
tools to effect changes to normal ASCII files.
The paradigm we have adopted (from
the KOS concept developed at Cedar Tree Software) assumes that what the reader
wants to do is important enough, to him/she, to warrant the understanding of
some formal category theory. However,
we keep the computer science to a minimum.
After reviewing the ACSII files in
the data folder, please open the SLIP 2.3.1 Browser. One needs to issue the
commands Import and then the command Extract to
load and reference an In-memory database system (I-RIB).
Once the extraction process is
complete (4-5 seconds) then one may click once on the A1 node. You will see a circle of atoms. Now issue the command cluster
to iterate the stochastic engine 100,000 times. This will take a few seconds.
The exercise is to move the large
cluster, from A1, into B3. Move the
second largest cluster into B2, and the remainder into B1. If you have done this well B2 and B3 will be
primes. You will have three clusters in
B1. The names you give these clusters
may, of course, be different.
Move the three primes from B1 into
C1, C2 and C3.
We suggest that you issue the
command random and then cluster several times until
you happen to get a limiting distribution where the two spikes and that which
is left is easy to bracket. Remember
that the bracket command a, b -> name has to have the a < b
so we do not bracket across the 0. This
is a technical over sight on our part that will be corrected in a later release
of the free software.
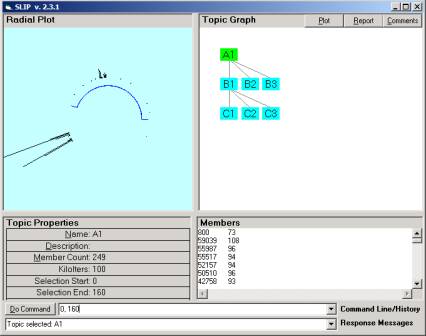
Figure 7: The prime
decomposition of a data set
Clustering to 100,000 iterations produces
a distribution self-similar to Figure 2.
In Figure 2 we see that inspection allows us to find two large primes {
D1, D2 }. Figure 3 show two large
primes using the eventBrowser. What we
see in Figure 7 is a clear delineation between the two primes and the
residue. It may be that for a quick
understanding of the visualAbstractions from the events in the data we can use
a split. The Splitter browser (see
Figure 4) is available to create those splits.
We will look into the event
chemistry for each of these five prime compounds
{ C1, C2, C3, B2, B3 }.
We will get them two different
ways. First double click on the A1
node. The eventChemistry browser will
open and in about a minute the atoms and compounds will be developed. This process is not optimized with an I-RIB
yet. However, the resources are stored
so that opening a second time will take less time.
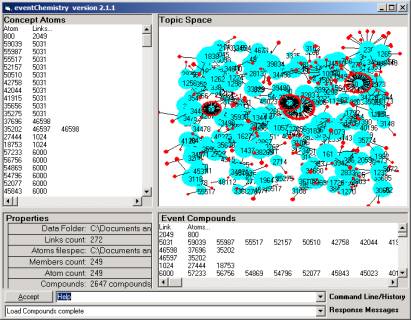
Figure 8: The random
scatter of atoms in to the object space.
From the red color one can make out
the five atoms having many valences.
Clicking on each of these five atoms will produce the icons seen in the
Vader Control Panel mock up.
As we have seen in the early
tutorials, the colors of the atoms and links can be changes. Command the
browser “help” to find out how to do this. The default colors are re-obtained by the
commands as atom cyan and link red. In this version of the software (2.1.1) the
colors are seen on the next view of objects.
Labeling is also turned on and off with the commands legend 0,
legend 1 or legend 2.
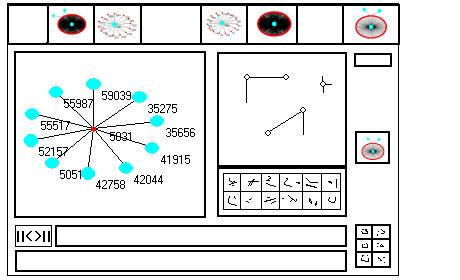
Figure 9: Mock up of a
Vader controller
Remember that simple compounds are
defined as a set of atoms that are joined by a single link type. Complex compounds are groups of
inter-connected by more than one link type.
A prime is either simple or complex.
The reader should find each of the
visualAbstraction objects seen in the depicted Vader Controller (Figure
9). Click on the line of text in the
event compound window.
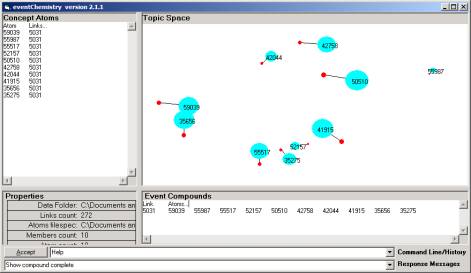
Figure 10: A simple
prime
For example, the ten atoms of one of
the primes are scattered into the object space. These atoms are organized in the simple compound seen in Figure
9.
Section 2: The 1/10 split
We will now take a 1/10 split of
the data that produced the compound in Figure 10 and see if we can find this
same compound { 5031 } again in the new collection of visualAbstractions. We will find two things, both very helpful
in our discovery of what the new visualAbstraction stuff is all about.
First, we will find exactly three
objects.
{5031, 80, 0}
Each of these objects is prime AND
simple.
Second, we will find that 100% of
the data in this 1/100 th of the 14 mins of trunk data is completely described
by these three simple objects. What
this suggests is that real time review of a data stream can take random samples
(splits) to identify and bring into high resolution the various “characteristic
objects” in that event space. These
objects should be viewable in a new OSI browser that we have giving the code name
“eventBox”. EventBox is the prototype
for the Vader Control panel.
Unzip internetTrunk.zip,
(which you should already have downloaded from Section 1), into a new folder.
The WinZip generally allows one to specify a new folder. The reader now has a new project.
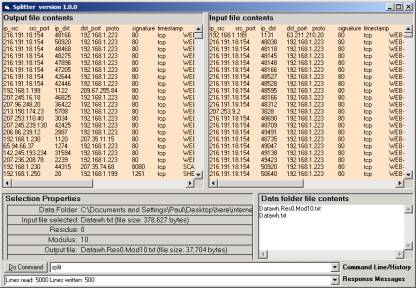
Figure 11: The use of
the Splitter
On opening the Splitter browser,
issue the commands: { modulus 10, select Datawh.txt,
split } to produce Figure 11.
Now delete the Datawh.txt file and rename the new file,
Datawh.Res0.Mo.10.txt, as the new Datawh.txt.
Open the Warehouse Browser. Command a = 3 and b
= 1
Use the commands pull
and export to produce the files that the SLIP Technology Browser
needs.
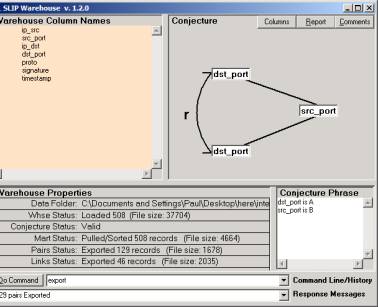
Figure 12: The
conjecture on the split
On opening the SLIP Technology Browser,
we find that there are about 1/10 the number of atoms, 26,that was in the
Section 1 data. This means that the
fractal phenomenon has dissipated, because the total data goes below a certain
level. We will study this phenomenon
at some point. What we predict is that
a saturation process occurs where at first the number of new objects that
appear are in linear proportion to the number of log records. As the data sample increases, the number of
objects per unit of data logs records decreases and eventually saturates.
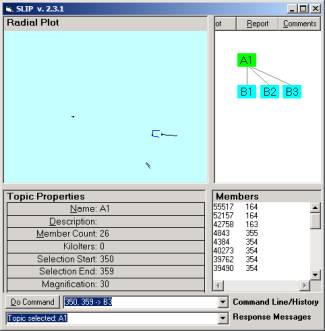
Figure 13: The SLIP
framework for 1/1000 of the original data
The 1/10 random split of a 1/10
random split is shown in Figure 13. The
original data set has 56,816 records.
This data set has 508 records.
At 1/100 of the original data we
find that the data is fully represented by only three objects (see Figure 14).
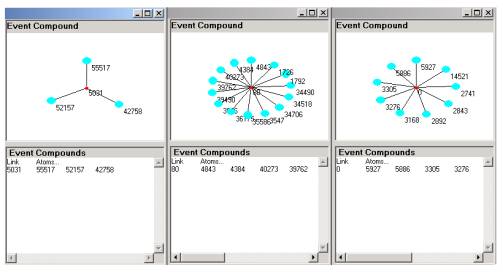
Figure 14: There are
only 3 compounds {5031, 80, 0} in the 1/100 split
The three object can be used to
retrieval any part of the original data.
What is even more interesting is that the visualAbstractions can be used
to retrieval the data that exists in other data sources that if analyzed would
produce some of all of that visualAbstractions. This needs to be subject of a research project.
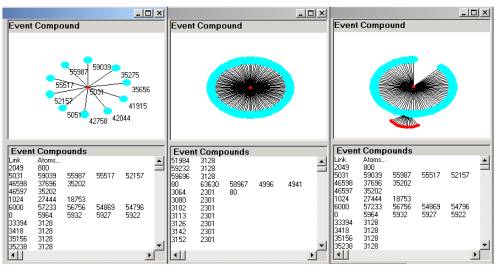
Figure 15: The same three compounds { 5031, 80, 0 } in
the 1/10 split
By reviewing Figure 15 and 14, one
might begin to see what it is that Don Mitchell and I are trying to reveal to
everyone.
Section 3: Consulting and research
We have made the decision to give the
technology and the software away in the form of this scientific tool set. The tools are complete and fully functional. So anyone can work on either empirical study
or theory.
We expect that a small science
community will begin using visualAbstractions and that the eventChemistry e-Journal will develop into a peer
reviewed publication platform.